About GraphPad Prism


GraphPad Prism pricing
GraphPad Prism does not have a free version but does offer a free trial. GraphPad Prism paid version starts at USD 252.00/year.
Alternatives to GraphPad Prism
GraphPad Prism Reviews
Feature rating
- Industry: Civil Engineering
- Company size: 501–1,000 Employees
- Used Monthly for 2+ years
-
Review Source
Friendly and easy to use
I usually use it for presenting my data analysis, I totally recommended for beginners or people who wants decent graphs for their presentations.
Pros
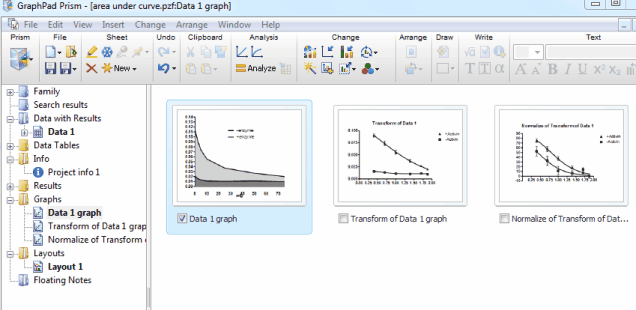
I used it for my data analysis because it is easy to use and to learn. The students that have struggles with others competing software, then when they try to use GraphPad they have no problems for their statistics analysis. Also, it forces the user to organize data which makes easier to work your data and its analysis. In my view, it is the best for presenting data in graphs, because these graphs and tables look very professional, and they're easy to interpret.
Cons
In overall I don´t have any problem with this software, my only problem is that it could be some expensive for students.
- Industry: Research
- Company size: 11–50 Employees
- Used Weekly for 2+ years
-
Review Source
Best tool for statistical analysis
I have been using this software for statistical analysis of my data for many years now. It is quite reliable and is widely used across my field. Overall, I am quite satisfied with this software.
Pros
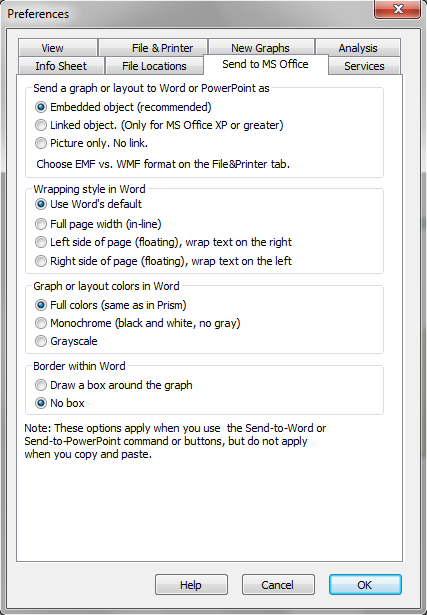
The wide range of statistical operations one can perform using GraphPad Prism is quite impressive. The most attractive feature of this software is that the algorithms are deftly designed to churn out precise results and the "Help" section provides great insight into the principle of the statistical program to be used. Moreover, the compatibility of the software with other applications, such as Microsoft Word, Powerpoint is very useful, especially for exporting data files directly by circumventing the need for copying and pasting.
Cons
There in nothing in particular that I dislike about this software. However, a useful section such as "QuickTips" for some basic statistical programs can help new users get acquainted to this software.
- Industry: Research
- Company size: 5,001–10,000 Employees
- Used Weekly for 1-5 months
-
Review Source
Graduate student
Bad
Pros
I do not like this software as it is not as easy and user friendly as excel is.
Cons
I am used to the flexibility of excel and graphpad is so confusing and limited for me. you have to know data tables very well otherwise you can not carry out any operation
- Industry: Research
- Company size: 10,000+ Employees
- Used Weekly for 2+ years
-
Review Source
Truly powerful and versatile
Pros
I used this technology as a researcher for nearly three years and it continues to blow me away all that you can do with it. They have expanded their repertoire of statistical tests you can run on the program and the graph making is extremely user friendly. For my manuscripts, I pretty much only use Prism to make my figures.
Cons
While many statistical tests are available, it would be wonderful if some of it could become automated. For example, if there is an option for two-way ANOVA with multiple comparisons, a function should be written in to automatically display your statistics on the graph page and also display the asterisks/letters that you use to denote significance/
- Industry: Education Management
- Company size: 2–10 Employees
- Used Weekly for 2+ years
-
Review Source
A Powerful Statistical Tool
I exclusively used this tool in my research studies, and it is fantastic. It did the job amazingly well, and let me produce great graphs with the color palette I wanted.
Highly Recommended.
Pros
It's an extremely powerful statistical tool with so many options and intricacies. Whatever you want to test statistically can most probably be done via GraphPad Prism.
You have complete control over the final look of your graphs as well; colors, shapes, lines, text..etc
Cons
It has a bit of a learning curve, you need someone to show you how to navigate your way around.
It can be daunting at first as well and frustrating at times.

